Weather data
One of the strengths of Pandas is in analysing time series of measurements. Just to show what is possible, let’s take an example from https://www.bergensveret.no/ by UiB’s skolelab. These three data files contain weather data collected over 3 years, every 10 minutes.
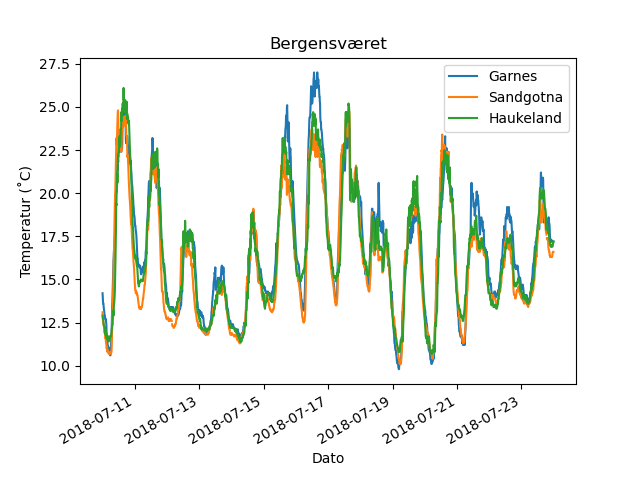
Comparison
This code compares the three stations during July 2018:
import pandas as pd
import pylab as plt

stations = [
"Garnes-2016-01-01-2019-09-16.csv",
"Haukeland-2016-01-01-2019-09-16.csv",
"Sandgotna-2016-01-01-2019-09-16.csv",
]

# loop over 3 files and read 3 dataframes
# into a list
dfs = []
for stn in stations:
    df = pd.read_csv(
            stn,
            index_col = 0,
            parse_dates = [0],
            na_values = '-9999',
            header = 0,
            names = [
                'dato','trykk','temperatur',
                'vindfart','vindretning',
                'fuktighet'
            ]
    )
    df['skole'] = stn.split('-')[0]
    dfs.append(df)

# combine all dataframes in the list into one dataset
weather = pd.concat(dfs)

skolene = ['Garnes','Sandgotna','Haukeland']
for skole in skolene:
    # choose two weeks in July 2018
    utvalg = weather[weather.skole==skole].loc['2018-07-10':'2018-07-23']
    #utvalg.temperatur.plot()
    utvalg['temperatur'].plot()

plt.legend(skolene)
plt.title('Bergensværet')
plt.ylabel('Temperatur (˚C)')
plt.xlabel('Dato')

plt.show()
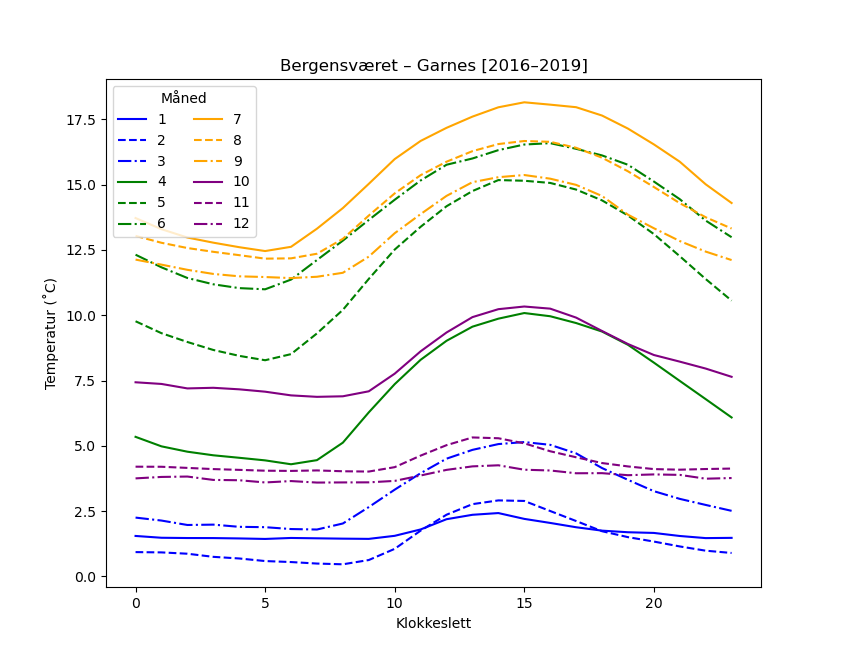
Grouping and averaging
We can also take one station and look at the average temperature during the day, for different months:
import pandas as pd
import pylab as plt

station = "Garnes-2016-01-01-2019-09-16.csv"

weather = pd.read_csv(
    station,
    index_col = 0,
    parse_dates = [0],
    na_values = '-9999',
    header = 0,
    names = [
        'dato','trykk','temperatur',
        'vindfart','vindretning',
        'fuktighet'
    ],
)

temp = weather.temperatur
# take the mean of all values in every month for every hour
grupper = temp.groupby([temp.index.month,temp.index.hour]).mean()

print(grupper)

# unstack level 0: use month as the different lines
grupper.unstack(level=0).plot(
    style=['-','--','-.']*4,
    color=['blue']*3+['green']*3+['orange']*3+['purple']*3,
)
plt.title('Bergensværet – Garnes [2016–2019]')
plt.legend(title='Måned',ncol=2)
plt.xlabel('Klokkeslett')
plt.ylabel('Temperatur (˚C)')

plt.show()